3D Lissajous Curves and Parametric Equations:
Experimenting with plotting Lissajous curves and parametric equations in three dimensions using three.js. (repository)
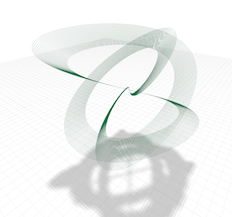
3D Harmonograph
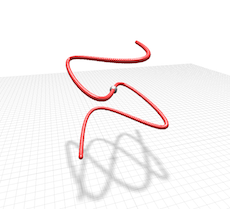
3D Lissajous dots
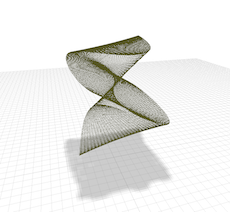
3D Lissajous mesh
See Also:
Lissajous Curve

Compound Radial Waves v3 [WARNING: LOUD!]

Compound Radial Waves v2

Compound Radial Waves

Compound Waves

Web Audio Experiments:
A series of experiments in using the Web Audio API for Digital Signal Processing. This is an ongoing series, usually featuring the exploration of different methods of manipulating or synthesizing sound waves at the sample level, often working directly with the audio buffer. (repository)
Web Audio Theremin & Oscilloscope

A sort of theremin that is controlled by tracking the mouse.
Web Audio Sampler with Effects

A Sampler with triggers that can be manually plotted and controlled by the keyboard. It also has Fade effects as well as Delay effects that adjust to match the beat. It comes with a small set of samples that can be used, but samples can also be loaded into the sampler client-side.
Audio Synth via d3-ease

A synthesizer that generates the waveshape by combining multiple waves that are generated by using d3's easing functions.
Phase Shifting

Reproduction of Steve Reich's "It's Gonna Rain" and "Come Out"
I Am Sitting in a Room - Alvin Lucier

Reproduction of Alvin Lucier's "I Am Sitting In A Room"
Wave Phasing

Perspective Tests:
An experiment in simulating a 3D perspective based on an optical illusion, but without using any 3D tools. (repository)
Hallway

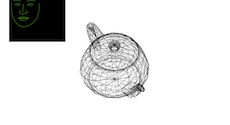
Teapot
Forced Perspective

Sound of the Stock Market:
A cost basis calculator and comparison tool, displaying the stock's weekly value on a Monday. Brushing the range chart adjusts the line chart so that the first instance of the stock is set to $1, showing how much that $1 would be worth at the end of the chart. Multiple stocks can be loaded for comparing their performance. I also added sound for fun. (repository)
Faster version that uses saved records instead of live.

Updated version of the Crossfilter.js demo
I am a big fan of Crossfilter.js and have used it extensively and the Crossfilter demo was one of the first examples I used for learning how to build dashboards. Version 4 of d3.js had some major changes that effect how it interacts with Crossfilter, so I decided to make an updated version of the demo to gain a better understanding of these changes. I also made a version that includes a map... (repository)
Updated version of the classic demo

My version with an added map of the airports.

Other projects and repositories:
D3.js plug-in for Sublime Text 3:
This is a collection of code completions and snippets to make working with and learning D3.js a little easier and quicker. It can be installed manually by downloading the zipped version or by (page on Package Control)
Featuring:
- Code completions and context menu for the entire D3.js library, organized to match D3's API Reference.
- code snippets for changes from v3 to v4.
- convenience snippets of commonly used features of D3.js.
FedEx Rate Calculator:
A desktop application built with Electron that communicates with FedEx's web services for address validation, service availability, estimated delivery date and/or time, and live rate quotes. Note that this requires a FedEx account, API key, API password, and meter number - all of which can be managed from the a password protected settings page. (repository)
Google Chrome Extension for viewing SSRS reports:
This extension fixes a a known issue with how the report is rendered in the browser. SSRS reports were designed to be viewed in Microsoft products, so this issue is due to Chrome rendering a certain style attribute differently than Internet Explorer. (page in the chrome web store)